Brain MRI
2025—2026
Five architectures on one set of brain scans, and the distance between what validation promised and what the test folder returned.
- Format
- Image classification, four diagnoses, five architectures
- My part
- Data preparation, training, evaluation
- Tools
- Python · PyTorch · torchvision · scikit-learn · Colab
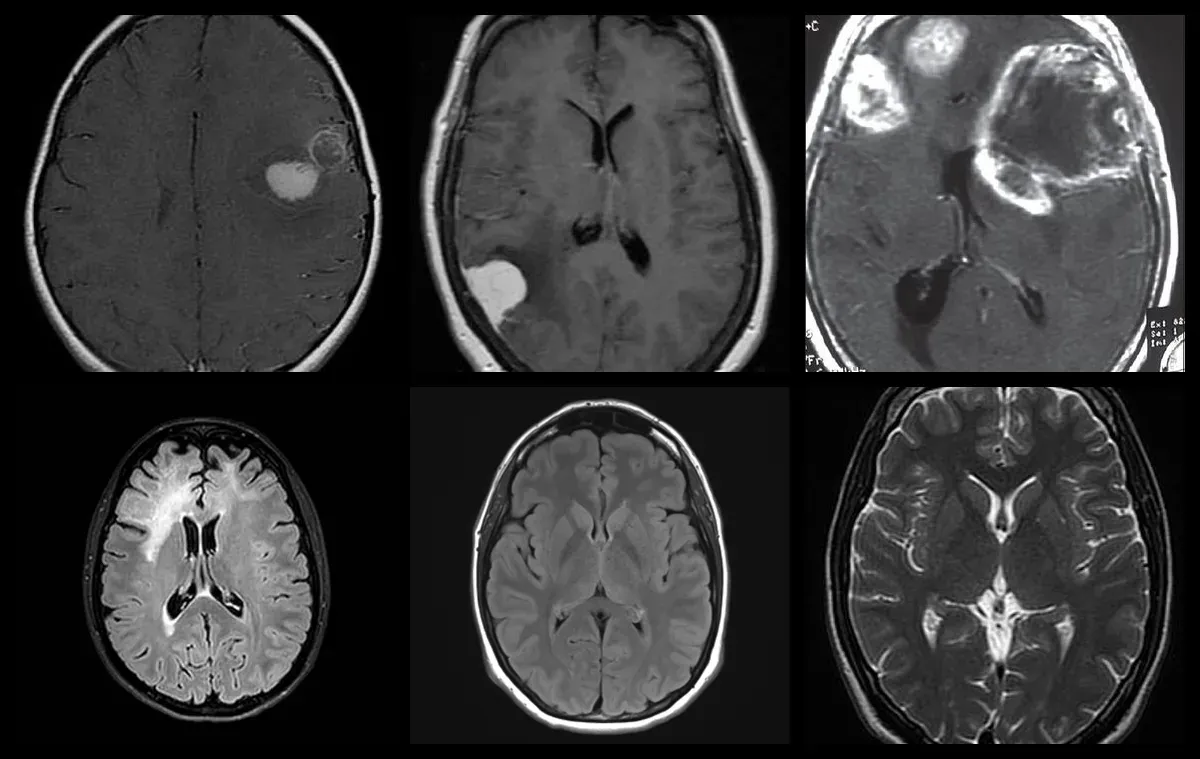
Four-class classification of brain MRI: glioma, meningioma, pituitary tumour, and no tumour. About three thousand images from a public collection that ships its training and test material as separate folders. I compared five ImageNet-pretrained backbones on it: ResNet18, MobileNetV2, DenseNet121, EfficientNetB0 and a Vision Transformer.
Every model went through the same pipeline: images resized to 224 by 224, batch size 32, three epochs, AdamW, cross-entropy loss, and no per-model tuning. Holding the pipeline fixed is what makes the comparison mean anything. With a different schedule for each backbone the ranking would be measuring the schedules.
Validation accuracy came from an 80/20 split of the training folder and ran from 0.8955 for the transformer to 0.9652 for DenseNet121. On the held-out test folder, 394 images none of the models had seen, the same five scored between 71.1 and 78.4 per cent. Each one lost 18 to 21 points crossing that line.
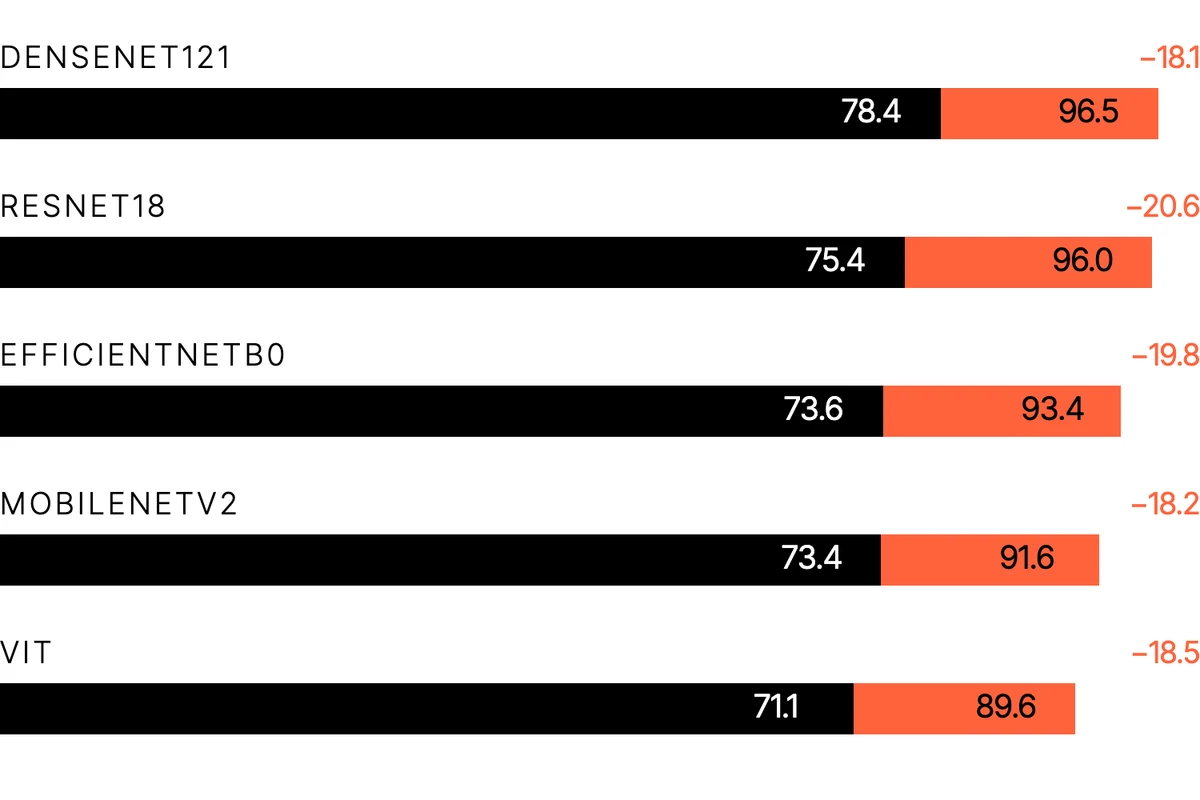
The gap is distribution shift rather than overfitting in the ordinary sense. The validation split is cut out of the training folder, so it inherits the same scanners, the same sequences, the same preprocessing. The test folder was assembled separately. A model scoring 96 per cent on one and 78 on the other has learned properties of the training collection alongside the properties of the tumours.
The loss is not spread evenly across the classes. DenseNet121, the strongest of the five, recovers 31 gliomas out of 100: it labels 35 of them meningioma and 32 of them healthy. Recall on the other three classes holds up, at 0.965 for meningioma, 0.990 for no tumour and 0.851 for pituitary. One aggregate figure of 78.4 per cent conceals a classifier that misses two thirds of a diagnosis.
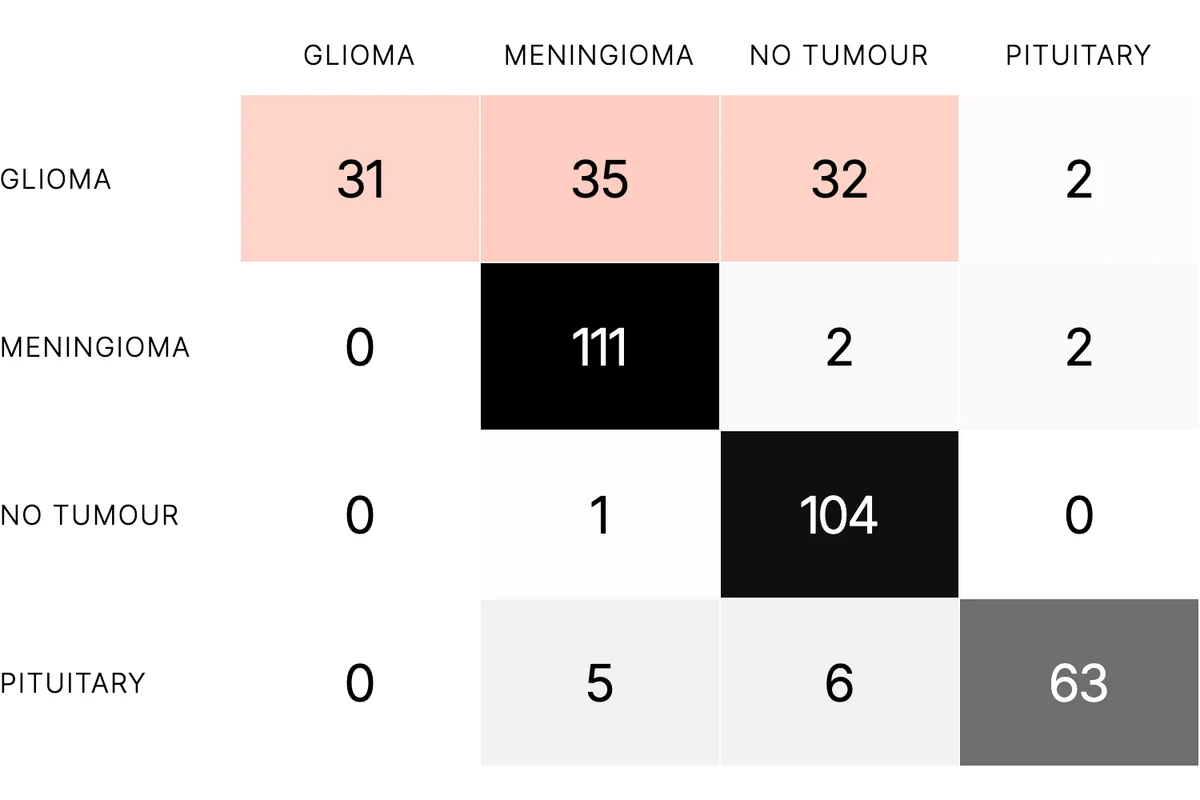
The ranking inverts as well. The Vision Transformer finished last on validation by a wide margin and returns the best glioma recall of the five, 34 out of 100. Ordering the models by a single aggregate metric selected the wrong one.
An earlier run of mine on the binary form of the task, tumour against no tumour on 506 images with ResNet18, reported 0.980 accuracy, 0.984 F1 and an AUC of 1.00. On a validation set of 102 images that last number is not evidence of much.
To treat any of this as a result I would want training and test images drawn from the same source, per-class recall reported next to the mean, and a radiologist to say whether the glioma slices in this collection differ systematically from the rest. Until then the figure worth quoting is 31 out of 100.